Understanding the Schumann Resonance chart can seem confusing at first.
Many people notice the colors, patterns, and sudden spikes but are unsure what they actually represent.
If you’ve ever checked the chart and wondered how to interpret it, this guide will help you understand the basics in a clear and grounded way.
What Does the Schumann Resonance Chart Show?
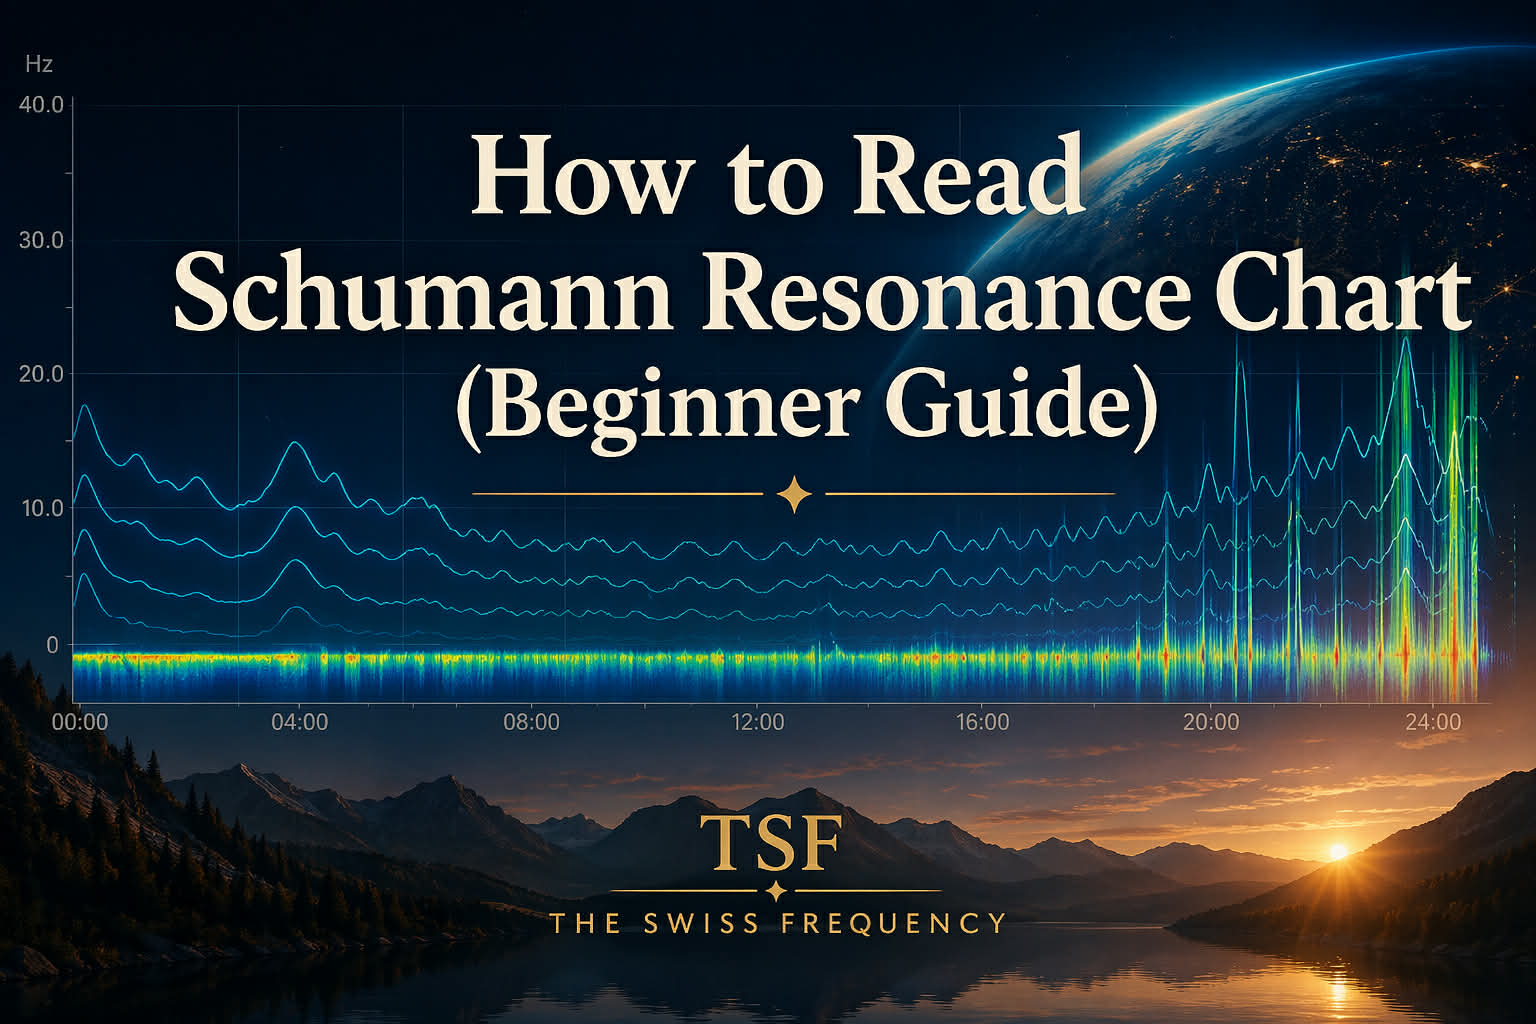
The Schumann Resonance chart displays electromagnetic activity in the Earth’s atmosphere over time.
These frequencies are primarily generated by lightning activity between the Earth’s surface and the ionosphere.
The phenomenon itself is well documented in science. It represents naturally occurring electromagnetic waves that circulate around the planet.
For a more detailed scientific explanation, you can explore this overview.
The chart is a visual representation of this activity. It does not predict events or directly explain human experiences – it simply shows changes in the Earth’s electromagnetic environment throughout the day.
Understanding the Colors on the Chart
One of the most noticeable features of the chart is its color variation. These colors indicate different levels of intensity.
In most charts:
• dark blue or black → low activity
• green and yellow → moderate activity
• red, white, or bright areas → higher intensity
Brighter colors do not mean something is “wrong” or unusual.
They simply reflect stronger electromagnetic signals at that moment. It’s important to see these colors as measurements – not interpretations.
What Do Spikes Mean?
Spikes are one of the most talked-about features of the Schumann Resonance chart. They usually appear as bright vertical lines.
These spikes indicate short periods of increased electromagnetic activity. This can happen due to natural causes such as:
• increased lightning activity
• atmospheric changes
• ionospheric variations
Spikes are temporary and part of the Earth’s normal behavior.
Many online discussions connect spikes with emotional or physical experiences, but there is currently no scientific consensus supporting a direct cause-and-effect relationship.
Why Do People Pay Attention to the Chart?
People monitor the Schumann Resonance chart for different reasons. Some are interested in the scientific aspect and want to observe natural environmental patterns.
Others see it as a way to stay connected to the Earth’s rhythm. In recent years, it has also gained attention in online communities focused on awareness, energy, and personal well-being.
For many, the chart serves as a daily reference rather than something to interpret literally. If you’re curious about live measurements, you can explore real-time data here.
Common Misinterpretations
A common misunderstanding is the belief that the chart directly explains how someone feels on a given day.
For example, if someone feels tired or overwhelmed, they may look at the chart and assume that a spike is the cause. However, human experience is influenced by many factors, including:
• sleep quality
• stress levels
• emotional load
• daily habits
• nervous system state
The chart reflects environmental data — not personal conditions. Understanding this helps avoid unnecessary worry or overinterpretation.
How to Use the Chart in a Balanced Way
Instead of analyzing every change, it can be more helpful to approach the chart as a simple awareness tool.
You might ask yourself:
• How do I feel today?
• Do I feel calm, tired, or overstimulated?
• Do I need rest or movement?
This approach keeps the focus on your internal state rather than external data.
The chart can support awareness – but your body gives the most important signals.
Connection to the Nervous System
Your daily experience is often more closely linked to your nervous system than to environmental data.
When the nervous system is overloaded, even small changes can feel more intense. That’s why supporting your system is key.
Helpful practices include:
• spending time in nature
• reducing digital stimulation
• slowing down your breathing
• allowing quiet moments
These simple habits help the body return to a balanced state.
Final Thoughts
The Schumann Resonance chart is a visual representation of natural electromagnetic activity. It reflects the Earth’s rhythm – not a prediction of how you will feel.
Learning how to read it can bring clarity and reduce confusion. But instead of overanalyzing every detail, it may be more helpful to stay connected to your own body and needs.
Sometimes, the most powerful insight comes from slowing down.
If you’d like a simple overview of today’s energy, you can explore it here:
→ Explore today’s Daily Energy Update